サインイン
はじめてのオートメーションをわずか数分で作成できます。Studio Web を試す →
Graph Activities for Microsoft Excel Charts
作成者: Balamurugan Shanmugasundaram
2
アクティビティ
7.7k
要約
要約
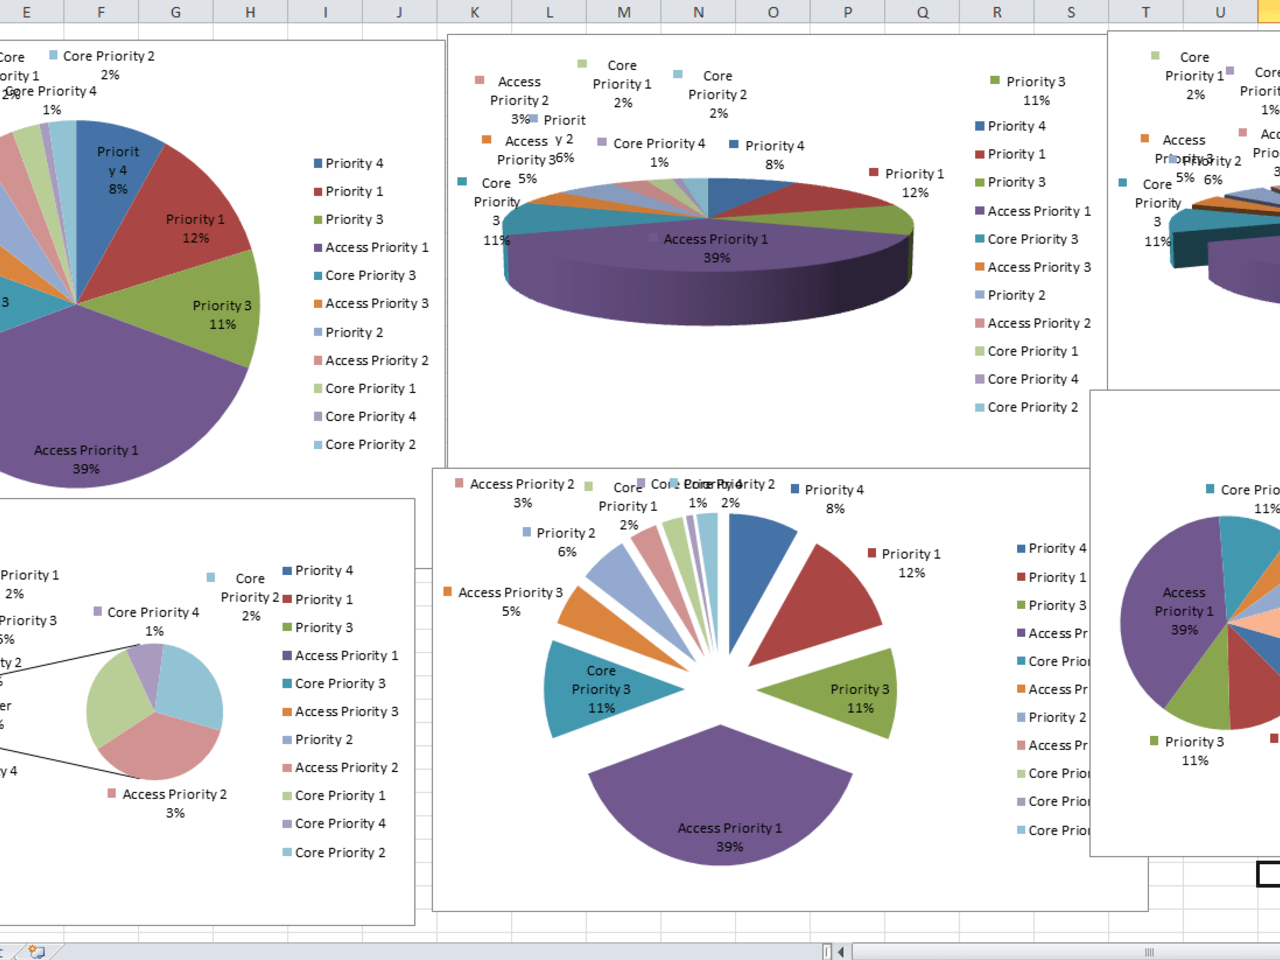
By using this activity you can create Pie, Column, Line and Bar graphs.
概要
概要
This custom activity automates the creation of charts inside an Excel sheet.
Properties:
1. Cell Range - Specify the data range for the Excel sheet.
2. Chart Title - Title for the chart.
3. Chart Type - Supports 26 chart types.
4. File Path - Excel file full path.
- Image Copy – Specify the path where the chart has to be saved as an image.
6. AutoText - Automatically generates appropriate text based on content.
7. DataLabelsType - [ShowNone, ShowValue,ShowPercent,ShowLabel, ShowLabelAndPercent, ShowBubbleSizes].
8. Had Lead lines - if the series has leader lines.
9. Legend Key - Show the legend key next to the point.
10. Separator - The separator for the data label.
11. Show Bubble Size - The bubble size for the data label.
12. Show Category Name - The category name for the data label.
13. Show Legend - True to show the legend to the chart.
14. Show Percentage - The percentage for the data label.
15. Show Series Name - The series name for the data label.
16. Show Value - The value for the data label.
17. Sheet Name - Excel book’s sheet name where the data exists.
18. Size - Height, left, top and width are for the position and size of the image.
機能
機能
1.This packahe contains a single activity for multiple charts types (Pie, Column, Line and Bar graph).
2. It requires a few input parameters.
3. It offers the ability to position the chart at the desire place.
4. Can make a the copy of a chart as image.
5. Can fix the size of the chart using height and width.
その他の情報
その他の情報
依存関係
Microsoft.Office.Interop.Excel
コード言語
C#, Visual Basic
ランタイム
Windows レガシ (.Net Framework 4.6.1)
ライセンス契約とプライバシー条項
MIT
プライバシー条項
技術情報
バージョン
2.0.1更新日
2023年6月4日対応製品
Studio: 21.10 - 22.10
認定
シルバー 認定済み
アプリケーション
サポート
UiPath コミュニティ サポート
リソース


