製品
アクセラレータ
エージェント カタログ
パートナー ソリューション
プロフェッショナル サービス
コレクション
サインイン
製品
アクセラレータ
エージェント カタログ
パートナー ソリューション
プロフェッショナル サービス
コレクション
はじめてのオートメーションをわずか数分で作成できます。Studio Web を試す →
Kibana Plug-In Dashboards for UiPath
作成者: Internal Labs
2
ツール
440
要約
要約
Execution, Operations, and Queue Transaction Kibana Dashboard
概要
概要
Three basic Kibana Dashboards (Execution, Operations, and Queue Transaction) Metrics with single click Install Utility Tool that helps you get started with UiPath Dashboards
These three Dashboards provide 14 visualisations combined:
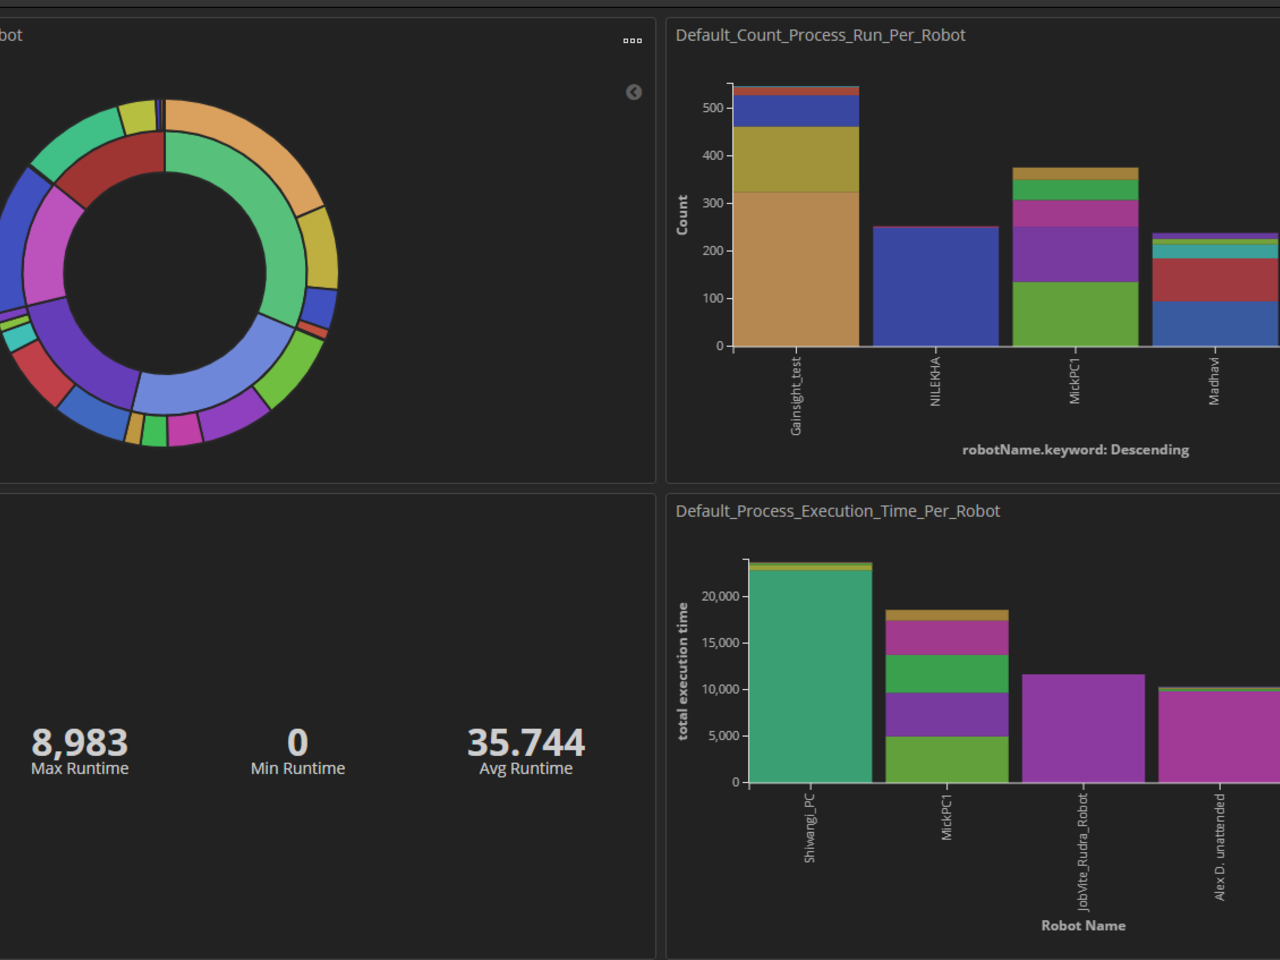
- Operational_Metrics : Provides 4 visualisations:
- Default_Pie_Split_Process_Runs_Per_Robot: Helps Visualise all the process run divided across the robots.
- Default_Count_Process_Run_Per_Robot: Helps visualise the robots running split by processes
- Default_Runtime_Metrics: Gives the Total Runtime, Max. Runtime, Min. Runtime and Avg. Execution Time of the processes
- Default_Process_Execution_Time_Per_Robot: Provides each bot's Utilisation.
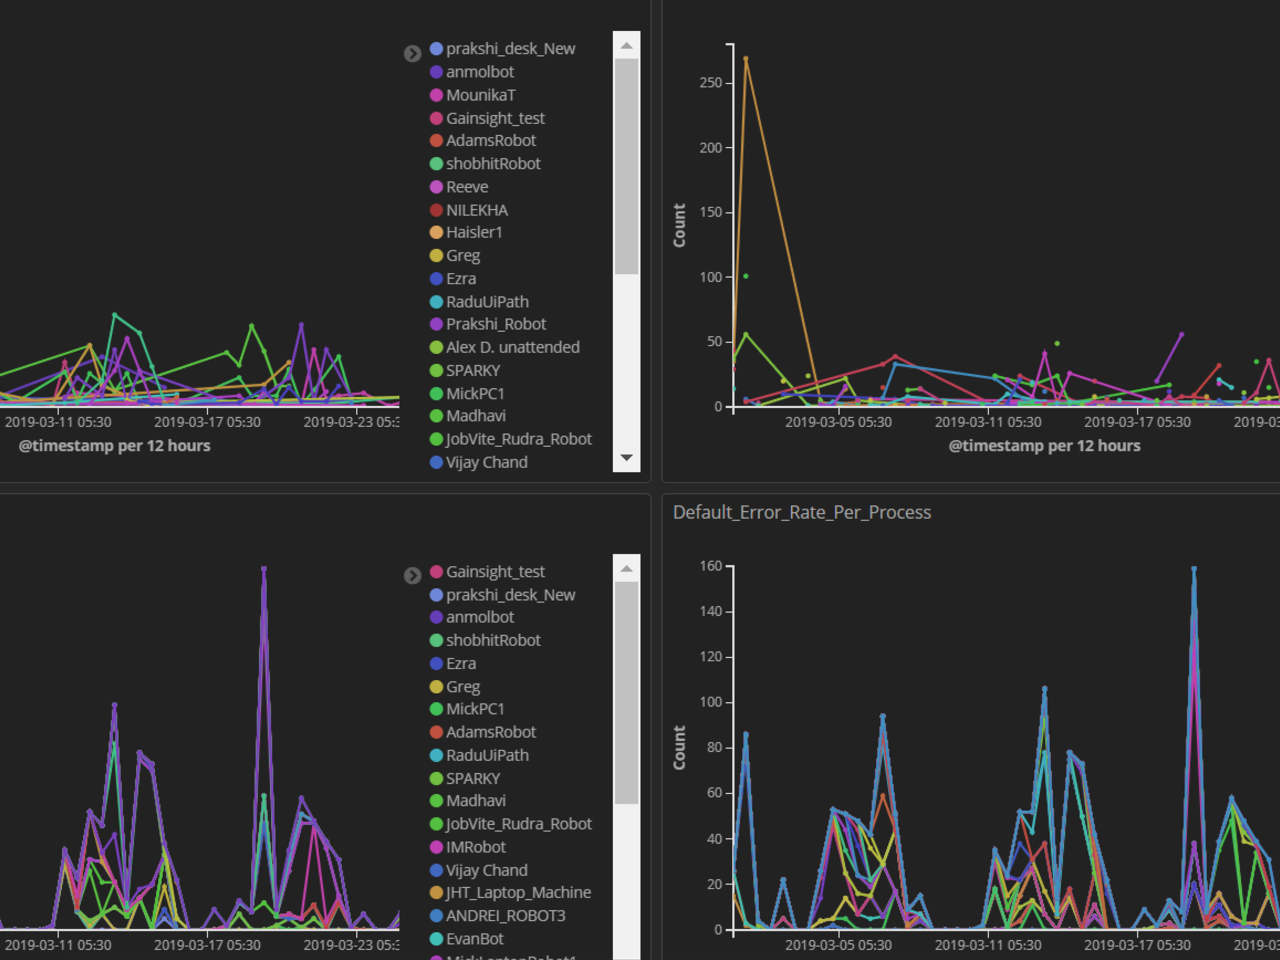
- Execution_Metrics: Provides 4 Visualisations:
- Default_Execution_Rate_Per_Robot: Gives execution count over time for each robot
- Default_Execution_Rate_Per_Process: Gives execution count over time for each process.
- Default_Error_Rate_Per_Robot: Gives error count over time for each robot
- Default_Error_Rate_Per_Process: Gives error count over time for each process
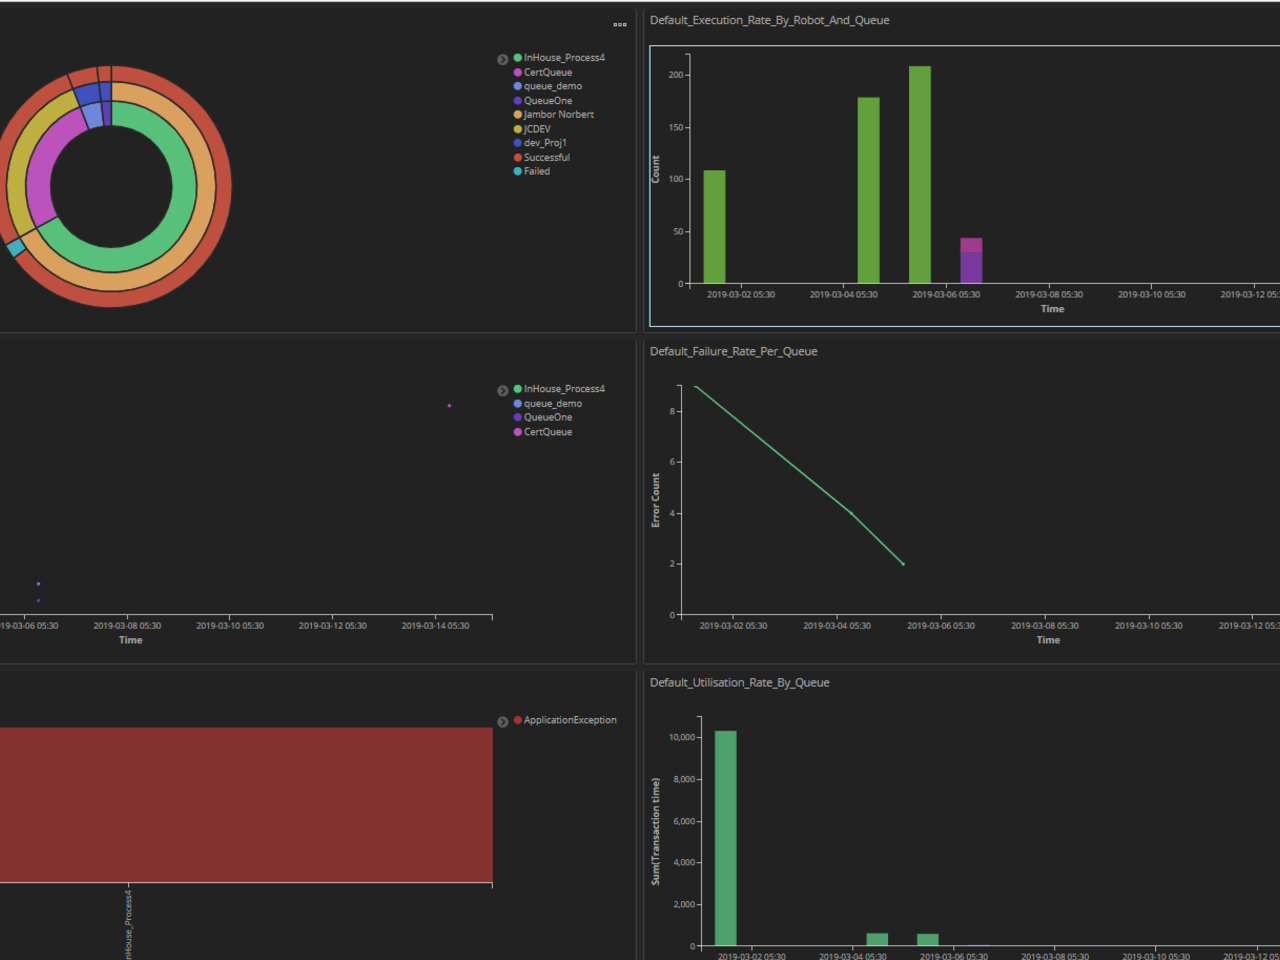
- Queue_Transaction_Metrics: Provides 6 Visualisations:
- Default_Transaction_Status_Per_Robot_Per_Queue: Status of the Transaction run per robot split by queue.
- Default_Execution_Rate_By_Robot_And_Queue: Transaction Execution by bots distributed per queue over time
- default_Transaction_Rate_Per_Queue: Rate of transaction execution per queue.
- Default_Failure_Rate_Per_Queue: Rate of transaction failure per queue.
- Default_Exception_Count_Per_Queue: Exception count and split by type for each queue
- Default_Utilisation_Rate_By_Queue: Time spent Default_Utilisation_Rate_By_Queue
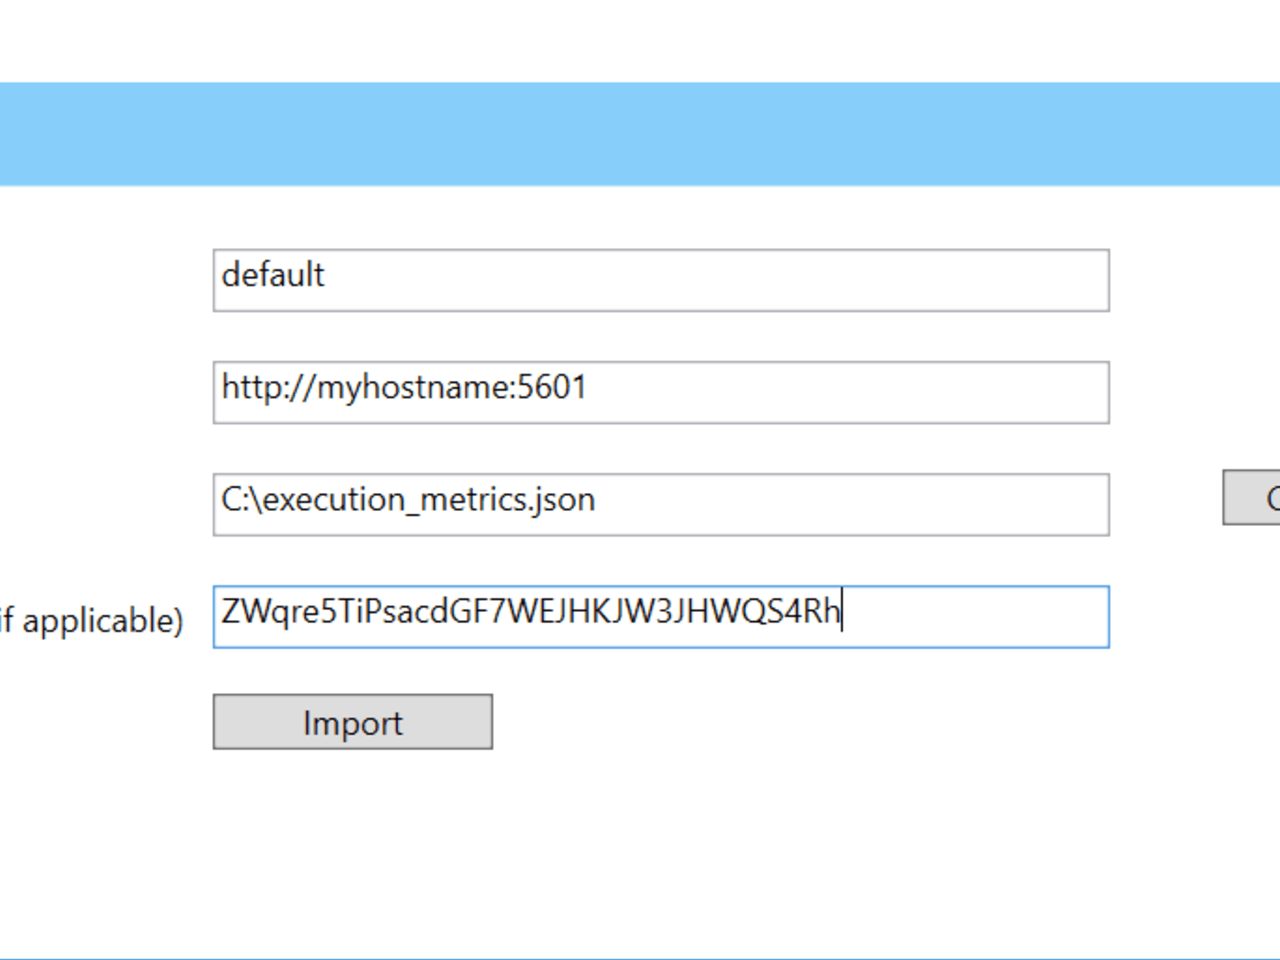
- There is a Utility Tool Called Kibana Importer which you can use to Import the dashboards to the user's kibana setup
- The given dashboards cover all the basic visualisations one needs to get started with UiPath specific monitoring and anlytics.
機能
機能
This caters to the need of organisations wishing to start with Basic Monitoring right away. The three dashboards cover the basic monitoring visualisation covering all the fundamental components of UiPath and Runtime behaviour of the processes. Moreover, the utility tool, KibanaImporter, assists you to get it done easily.
その他の情報
その他の情報
依存関係
Kibana 6.x and above.


