サインイン
はじめてのオートメーションをわずか数分で作成できます。Studio Web を試す →
Workflow Profiler
作成者: Internal Labs
1
アクティビティ
<100
要約
要約
The activity provides information about how the target activity is impacting the executor based on the process's performance counters.
概要
概要
What
Often, in the development process, you need a quick insight about the impact of the modifications in term of execution time, memory footprint or any other performance metric. This activity helps checking this without the need of embedded metrics or logs.
Who
Development teams or QA teams that want to ensure that there is no regression in terms of performance.
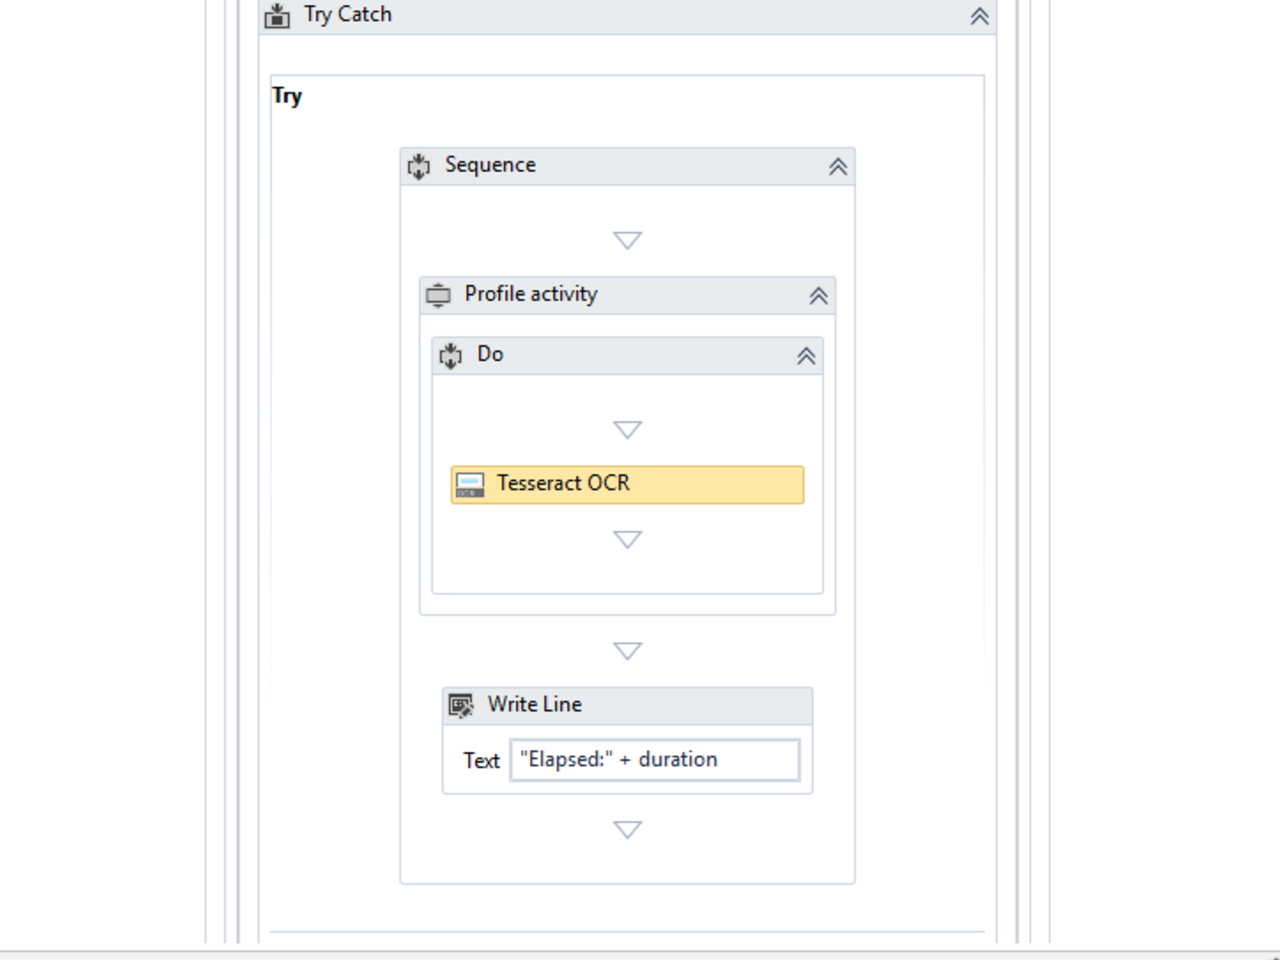
How
Drag the "Profile activity" in your workflow. Drag all the activities you want to check in the "Do" body of the activity.
Set a target ID which will be associated with the results. This can be a filename, a document ID or anything that can help in identifying the input set for which the flow was executed.
Set the performance counters you are interested in. This can be done by specifying the counter names separated by comma. In this version, only the performance counters from the Process category can be used. The output of the performance counters is always a delta value, the difference between the values before starting the activity and the values captured at the end of the execution. This gives you the impact over the executor.
Specify a folder and a file name without the extension. The file will be saved in a .csv format having as first column the target ID, followed by duration column and then by the selected performance counters columns. Some of the known performance counters are formatted in MB e.g. Working Set.
If your activity is starting another job in background and this is what you want to profile, then you need to specify the process name in the ProcessInstanceName input field. If empty, the containing process is profiled (the executor/robot).
Simple use case
Let's say you want to keep track of the performance indicators over different version of an activity. You may run a specific workflow having different inputs. Identify an ID of the input set and save the performance results in different files, one per used package version. At the end you will have a file for each version containing the profiling data for the same input set. When a new version is released you now have a baseline with which you can compare.
機能
機能
- Profiles your activity or workflow.
- Compares the improvement or regression between versions.
その他の情報
その他の情報
依存関係
None
コード言語
C#, Visual Basic
ランタイム
Windows レガシ (.Net Framework 4.6.1)


