Sign In
Create your first automation in just a few minutes.Try Studio Web →

DataTable Visualizer
by Indie Dev
1
Activity
<100
Summary
Summary
Visualize DataTables effortlessly with this activity.
Overview
Overview
This simple activity provides a convenient way to visualize DataTable data in a tabular view. It enhances data inspection with features like displaying the total number of rows and columns, indicating visible rows, and more. Edit mode is under development. Check out the Readme for a detailed description.
This activity is useful for UiPath developers during the development phase. It helps them quickly view data after making changes to a DataTable or after data scraping. It can also be used in production within an attended bot to show business users data for verification purposes.
The activity saves a significant amount of time and effort in data inspection. It eliminates the need to export DataTables to Excel for data visualization.
Features
Features
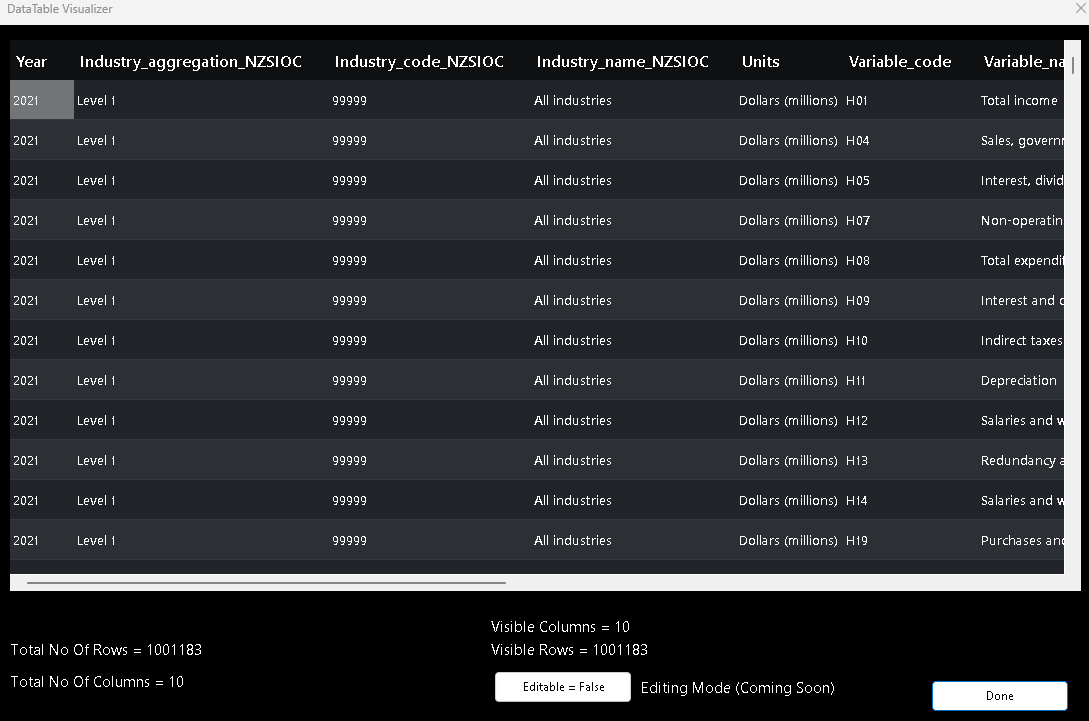
Table View Features:
1. Total No Of Rows:
- Displays the total number of rows in the DataTable.
2. Total No Of Columns:
- Shows the total number of columns in the DataTable.
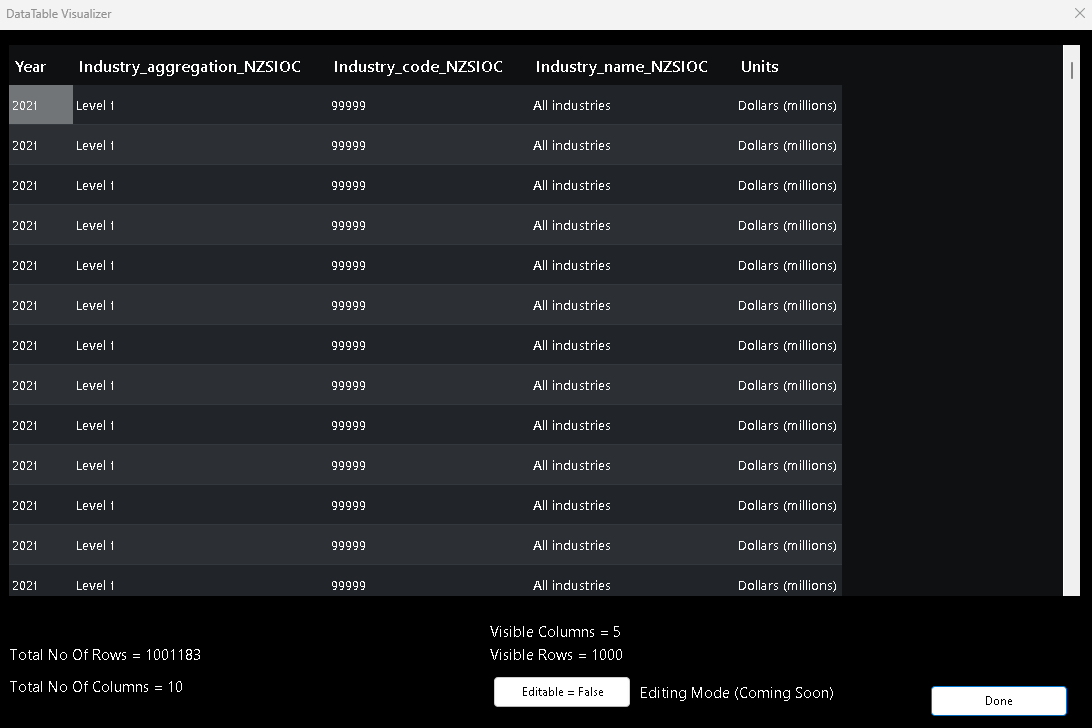
3. Visible Rows:
- Indicates the number of currently displayed rows in the TableView for effective visualization.
4. Visible Columns:
- Indicates the number of currently displayed columns in the TableView for effective visualization.
5. Editable Button:
- (Currently in Development) - Edit mode is under development and will be available soon.
6. Done Button:
- Closes the TableView when clicked.
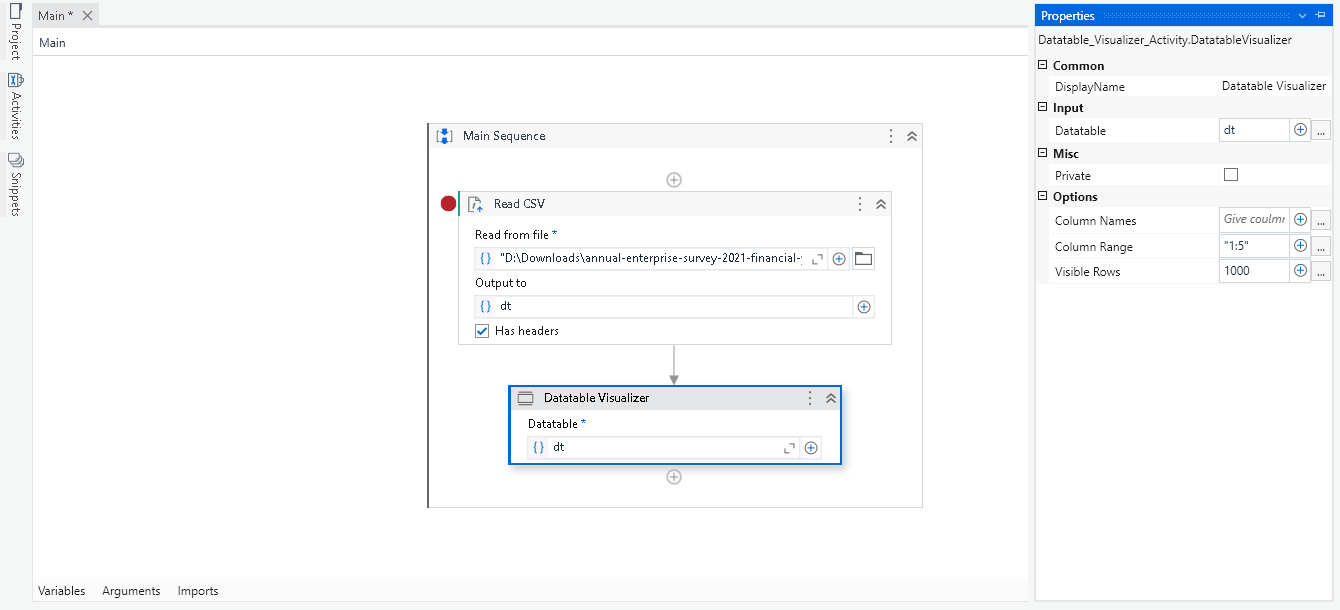
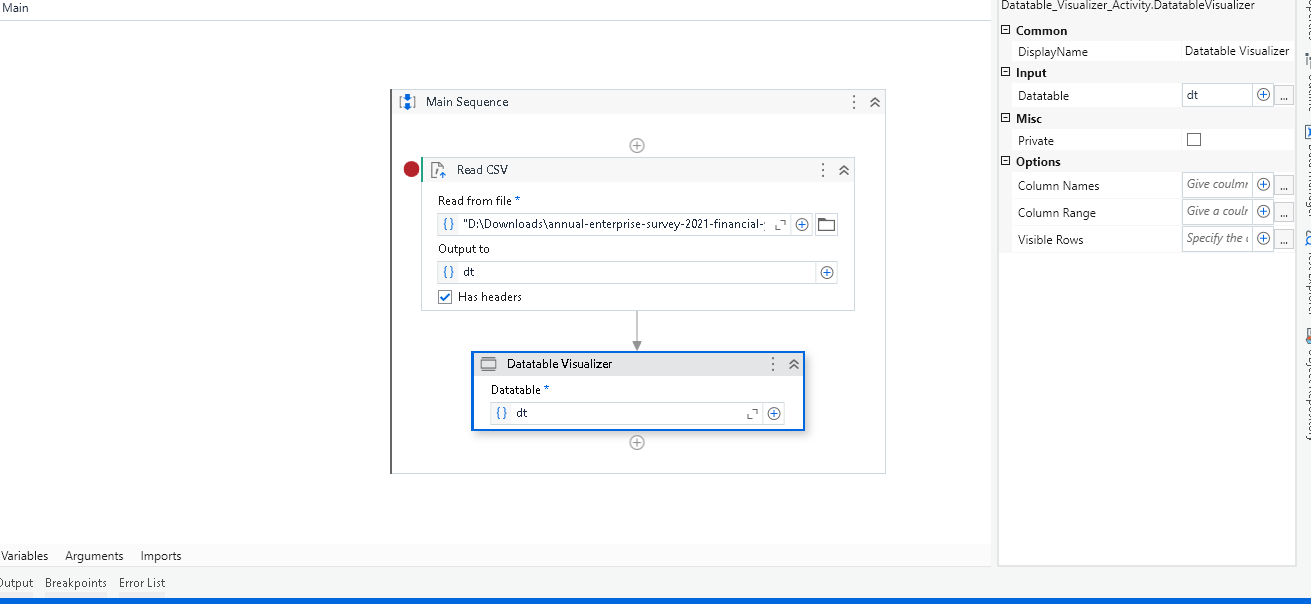
Activity Inputs:
1. Datatable:
- Add a DataTable (Refer to important notes for limitations).
2. Visible Rows:
- Specify the desired number of rows to display.
- Note:
- If the specified visible rows exceed the maximum threshold, it will be limited to the maximum allowed rows.
- If left empty, the entire DataTable will be used, considering the maximum rows threshold.
3. Column Range:
- Provide a column range, e.g., 2:10 (startColumn:endColumn).
- Note:
- The range should be provided as a count, not as an index of the columns.
- The max column threshold will also be applied to the total column count for Column Range.
4. Column Names:
- Provide column names.
- Note:
- If the Column Range field is provided, the Column Names field will not be considered.
- The max column threshold will also be applied to the total column count for Column Names.
Important Notes:
- Maximum Displayed Rows:
- The TableView will display a maximum of 1.5 million rows (15 lakhs).
- Maximum Displayed Columns:
- The TableView will display a maximum of 20,000 columns (20k).
Additional Information
Additional Information
Dependencies
None
Code Language
C#, Visual Basic
Runtime
Windows (.Net 5.0 or higher)
Technical
Version
1.0.1Updated
February 9, 2024Works with
Studio: 23.12.0+
Certification
Silver Certified
Tags
Application
Support
UiPath Community Support
Resources