サインイン
はじめてのオートメーションをわずか数分で作成できます。Studio Web を試す →
Kibana Jobs, Errors, and Queues Dashboards
作成者: Internal Labs
16
ツール
958
要約
要約
Interactive Kibana dashboards for jobs, errors, and queue processes, using data from robot logs pushed to Elasticsearch
概要
概要
This package includes 3 Kibana Dashboards - jobs, errors, queues.
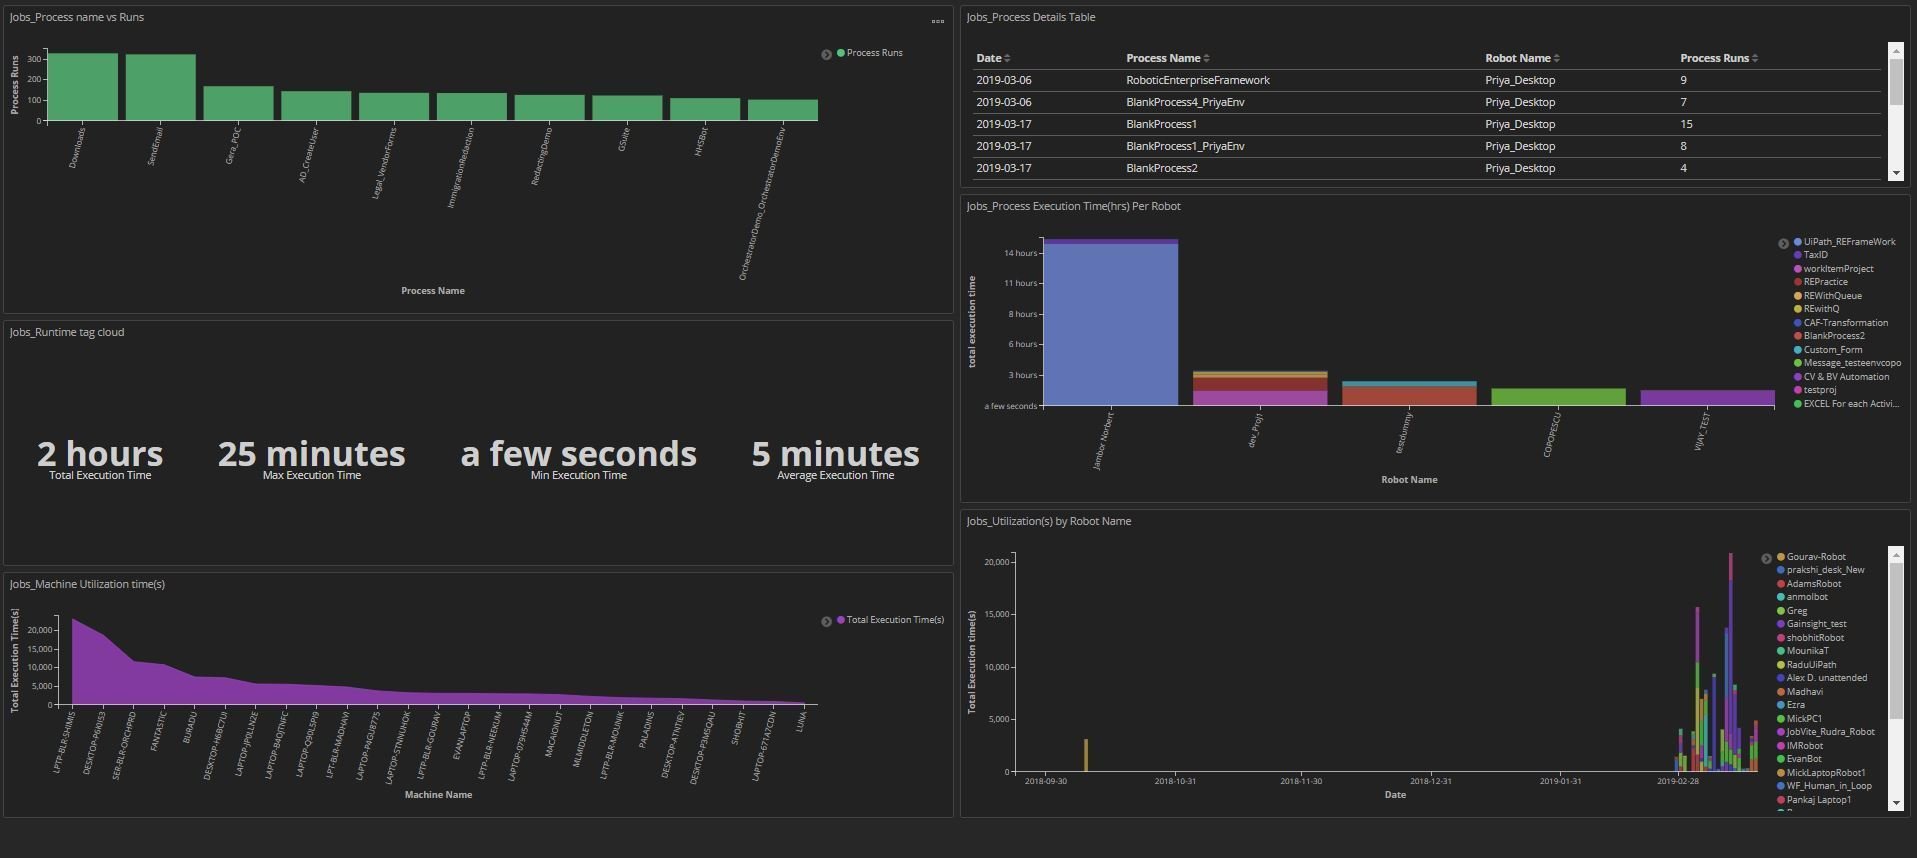
Jobs:
- Number of process runs
- Run-time summary metrics
- Details table with date, process name, robot name, and number of runs
- Execution time in hours of processes per robot
- Robot utilization time in seconds
- Machine utilization time in seconds
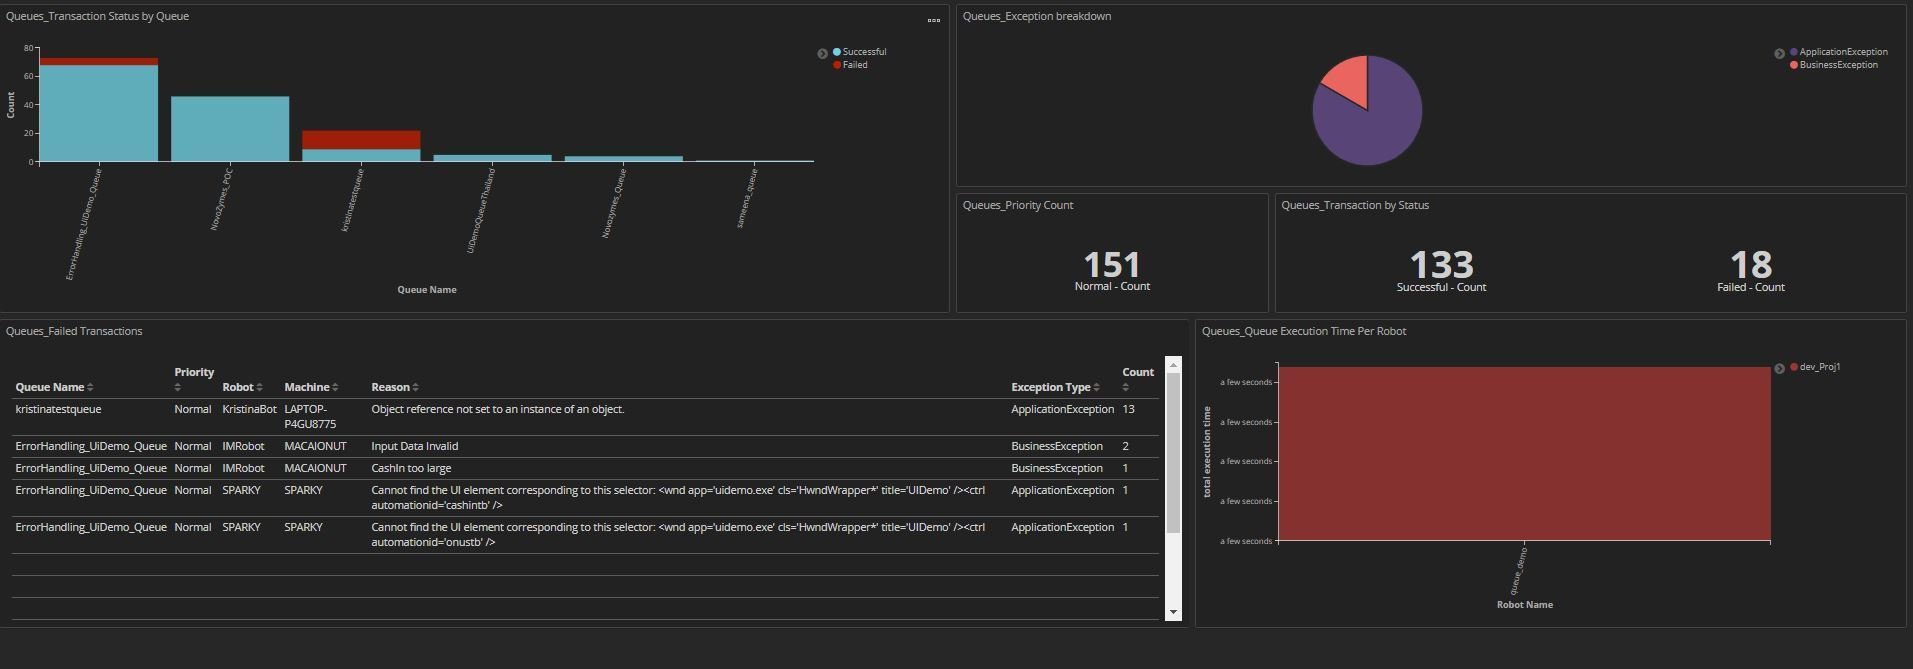
Queues:
- Transaction status by queue(successful vs failed)
- Exception type breakdown
- Total queue item count by priority
- Total transaction count by status
- Queue execution time per robot
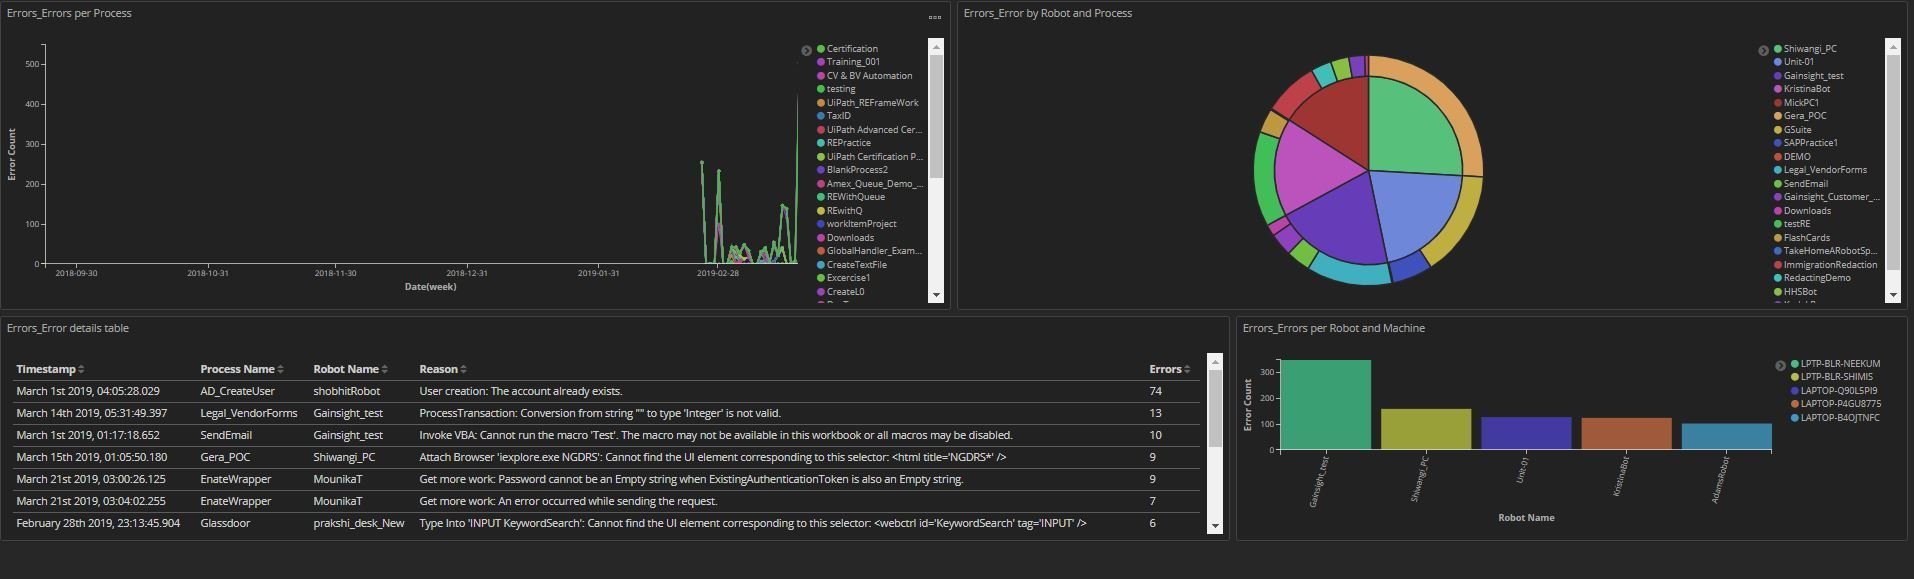
Errors:
- Errors per process
- Errors per robot per process
- Errors details table with timestamp, process name, robot name, reason, and count
- Errors per robot and machine
For more info about how reporting and analytics work, check out my blog posts:
Introduction to UiPath logging and analytics
機能
機能
The Jobs Dashboard: Provides an overview of the job activity in the selected time frame as well as over time. Allows the users to perform operational analytics, monitor their machine and robot utilization, and view other job-related KPIs. The Queues Dashboard: Provides an overview of the queue activity in the selected time frame as well as over time. Allows the users to identify queues for which the error rates are high and the types of error for queue items - an indicator of a need to change the way that queue is processed. The Errors Dashboard: Provides an overview of the common errors and processes that are failing most in the selected time frame as well as over time. Allows the users to identify which processes are causing bottlenecks and which robots and machines are most frequently involved.
その他の情報
その他の情報
依存関係
Kibana (At least version 6.0) Elasticsearch (same version as kibana) Orchestrator Elasticsearch must already be connected via Nlog to contain log data from the robot


