Create your first automation in just a few minutes.Try Studio Web →
Graph Activities for Microsoft Excel Charts
by Balamurugan Shanmugasundaram
2
Activity
7.7k
Summary
Summary
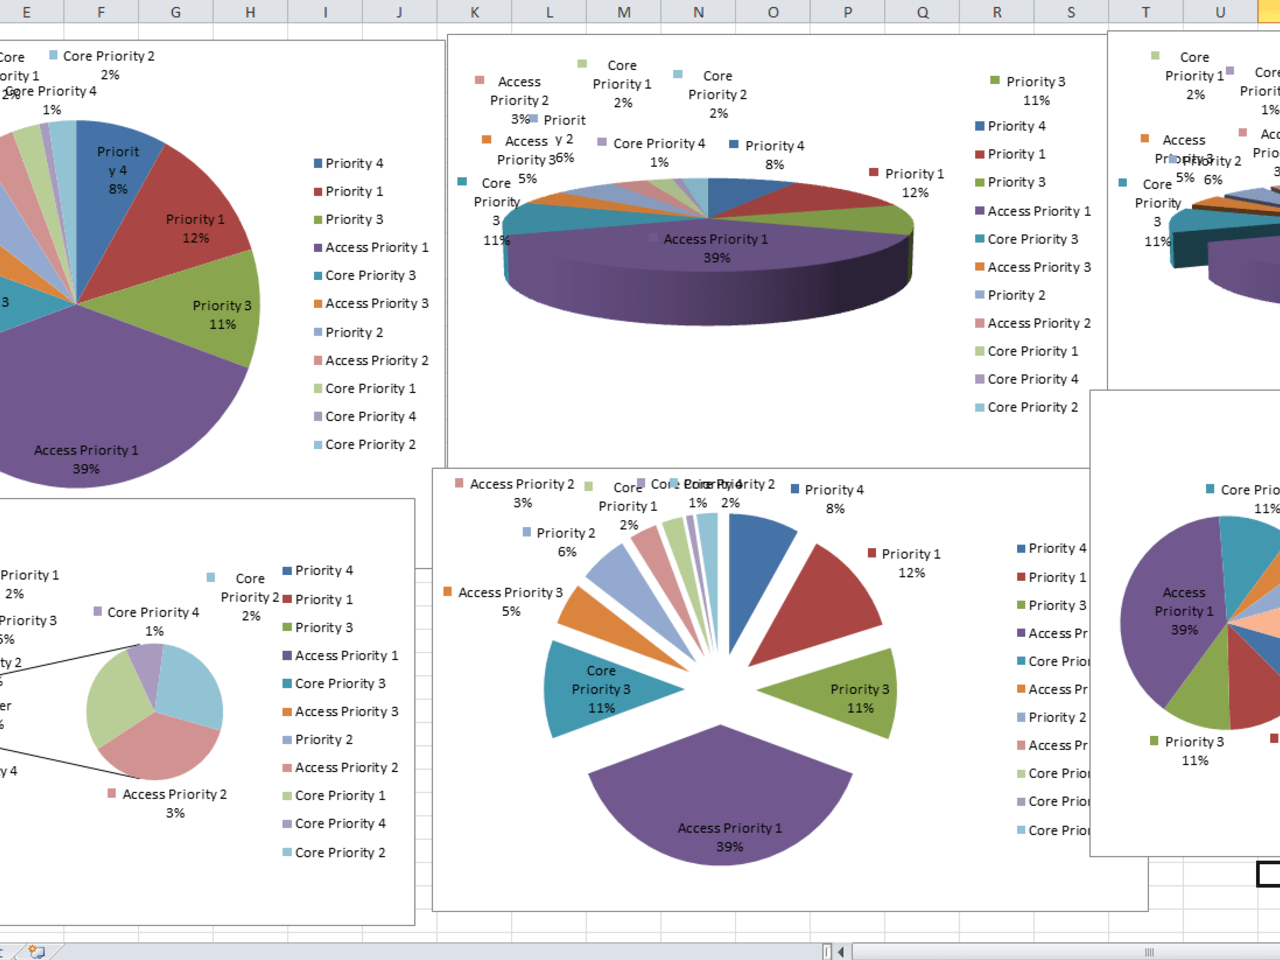
By using this activity you can create Pie, Column, Line and Bar graphs.
Overview
Overview
This custom activity automates the creation of charts inside an Excel sheet.
Properties:
1. Cell Range - Specify the data range for the Excel sheet.
2. Chart Title - Title for the chart.
3. Chart Type - Supports 26 chart types.
4. File Path - Excel file full path.
- Image Copy – Specify the path where the chart has to be saved as an image.
6. AutoText - Automatically generates appropriate text based on content.
7. DataLabelsType - [ShowNone, ShowValue,ShowPercent,ShowLabel, ShowLabelAndPercent, ShowBubbleSizes].
8. Had Lead lines - if the series has leader lines.
9. Legend Key - Show the legend key next to the point.
10. Separator - The separator for the data label.
11. Show Bubble Size - The bubble size for the data label.
12. Show Category Name - The category name for the data label.
13. Show Legend - True to show the legend to the chart.
14. Show Percentage - The percentage for the data label.
15. Show Series Name - The series name for the data label.
16. Show Value - The value for the data label.
17. Sheet Name - Excel book’s sheet name where the data exists.
18. Size - Height, left, top and width are for the position and size of the image.
Features
Features
1.This packahe contains a single activity for multiple charts types (Pie, Column, Line and Bar graph).
2. It requires a few input parameters.
3. It offers the ability to position the chart at the desire place.
4. Can make a the copy of a chart as image.
5. Can fix the size of the chart using height and width.
Additional Information
Additional Information
Dependencies
Microsoft.Office.Interop.Excel
Code Language
C#, Visual Basic
Runtime
Windows Legacy (.Net Framework 4.6.1)
License & Privacy
MIT
Privacy Terms
Technical
Version
2.0.1Updated
June 4, 2023Works with
Studio: 21.10 - 22.10
Certification
Silver Certified
Collections
Support
UiPath Community Support
Resources


